
This is Part 4 of a series on tax-efficient portfolio construction. This post focuses on fixed income — specifically how bond type affects after-tax returns for high-income investors in taxable accounts. Previous posts covered tax-efficient asset location, tax-loss harvesting, and equity fund tax drag. This post stands on its own but builds on the series theme: after-tax return is what compounds — and the differences between bond types can be substantial.

Image generated with AI assistance from ChatGPT.
What's the Best Fixed Income for After-Tax Returns?
What this post covers
- A hypothetical $100,000 invested in bonds — held for 60 years across four bond types
- Corporate bonds (4%), Treasury bonds (3.5%), municipal bonds (2.8%), California municipal bonds (2.75%)
- Same starting balance — the only difference is which type of bond
What happens
- After 30 years, the CA municipal bond portfolio leads the corporate bond portfolio by $40,431 — despite paying 1.25% less in gross yield
- After 60 years, the gap grows to $101,129 — 24.8% more than the highest-yielding option
- Municipal bonds (not CA-specific) also lead corporate bonds: +$42,199 at Year 60
The core insight
- Corporate bonds pay 4.00% — but after combined 48.1% tax (35% federal + 9.3% CA + 3.8% NIIT), after-tax yield is approximately 2.08%
- California municipal bonds pay 2.75% — exempt from all three taxes — so after-tax yield is 2.75%
- The bond that pays less before tax keeps significantly more after tax
Important context
- This applies specifically to bonds held in a taxable brokerage account — bond type makes no tax difference inside a 401(k) or Roth IRA
- The benefit of municipal bonds is bracket-specific — at lower income levels, the math changes considerably
- Credit risk, interest rate risk, and liquidity differences are not modeled here — this is a tax efficiency illustration only
Want the full detail? Read on.
Why Taxable Bonds May Keep Less After Tax Than Non-Taxable Bonds
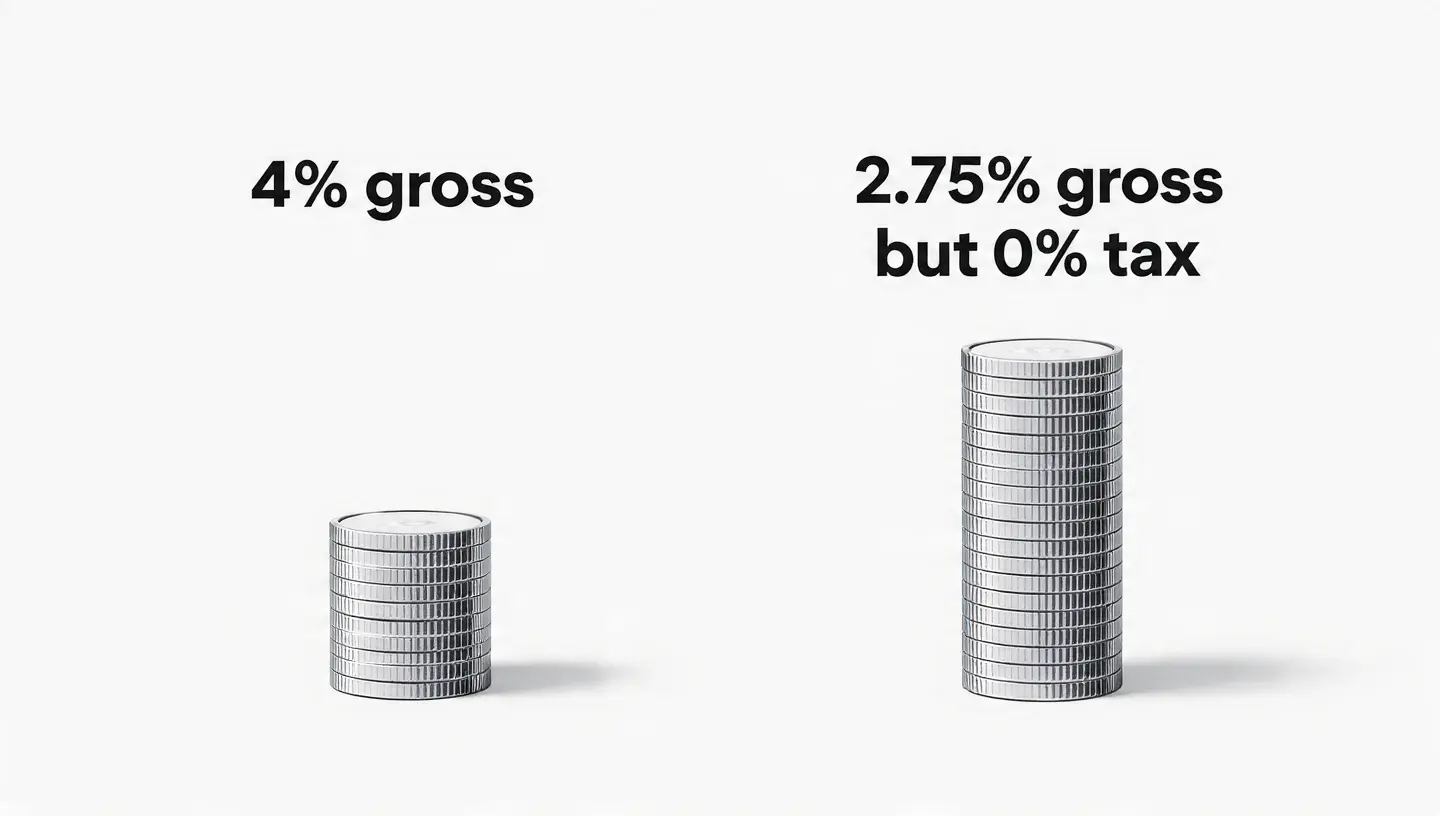
Image generated with AI assistance from Meta AI.
If you are a high-income California investor, which bond would you rather own in a taxable account — one paying 4% interest or one paying 2.75%?
The answer, under current tax law, is the one paying 2.75%.
Not because 2.75% is better math. But because the 4% bond — after federal income tax, California state tax, and the Net Investment Income Tax (under current law as of the date this article was written) — delivers approximately 2.08% in actual after-tax income.
The 2.75% California municipal bond delivers 2.75%, because that income is exempt from all three taxes.
Every dollar of bond interest you pay in taxes is a dollar that is no longer invested and compounding. For bonds held in your taxable account, bond type determines how large that annual tax bill is — and for a high-income California investor, the compounding difference over 60 years can be substantial.
This is bond tax drag.
How Do Tax-Exempt and Taxable Fixed Income Compare?
Let's set up a hypothetical scenario: a single taxable account with $100,000 invested entirely in bonds — held for 60 years: 30 years of accumulation, 30 years of retirement. No stocks. No contributions or withdrawals during accumulation. Interest is paid and taxed each year.
Four bond types are compared:
- Corporate bonds — 4.00% gross yield, fully taxable at all levels
- Treasury bonds — 3.50% gross yield, taxable federally and subject to NIIT, but exempt from California state tax
- Municipal bonds — 2.80% gross yield, exempt from federal income tax and NIIT, taxable in California at 9.3%
- California municipal bonds — 2.75% gross yield, exempt from federal, California state, and NIIT
Note: This illustration isolates tax efficiency. It does not model credit risk, interest rate risk, liquidity differences, AMT exposure, or call provisions. These are real considerations that should be evaluated alongside tax efficiency. The goal is to show the directional impact of tax treatment in isolation.
Tax rates and after-tax yields by bond type (as of the original publication date):
During accumulation (high-income bracket, NIIT applies):
| Bond Type | Federal | CA State | NIIT | Combined | After-Tax Yield |
|---|---|---|---|---|---|
| Corporate | 35% | 9.3% | 3.8% | 48.1% | 2.08% |
| Treasury | 35% | Exempt | 3.8% | 38.8% | 2.14% |
| Municipal | Exempt | 9.3% | Exempt | 9.3% | 2.54% |
| CA Municipal | Exempt | Exempt | Exempt | 0% | 2.75% |
During retirement (lower bracket, NIIT removed):
| Bond Type | Federal | CA State | NIIT | Combined | After-Tax Yield |
|---|---|---|---|---|---|
| Corporate | 24% | 9.3% | 0% | 33.3% | 2.67% |
| Treasury | 24% | Exempt | 0% | 24.0% | 2.66% |
| Municipal | Exempt | 9.3% | 0% | 9.3% | 2.54% |
| CA Municipal | Exempt | Exempt | 0% | 0% | 2.75% |
The Results
| Year | Corporate | Treasury | Treas. vs Corp | Municipal | Muni vs Corp | CA Muni | CA Muni vs Corp |
|---|---|---|---|---|---|---|---|
| 1 | $102,076 | $102,142 | +$66 (+0.1%) | $102,540 | +$464 (+0.5%) | $102,750 | +$674 (+0.7%) |
| 5 | $110,820 | $111,179 | +$359 (+0.3%) | $113,360 | +$2,540 (+2.3%) | $114,527 | +$3,707 (+3.3%) |
| 10 | $122,811 | $123,607 | +$796 (+0.6%) | $128,504 | +$5,693 (+4.6%) | $131,165 | +$8,354 (+6.8%) |
| 15 | $136,099 | $137,425 | +$1,326 (+1.0%) | $145,671 | +$9,572 (+7.0%) | $150,220 | +$14,121 (+10.4%) |
| 20 | $150,825 | $152,787 | +$1,962 (+1.3%) | $165,132 | +$14,307 (+9.5%) | $172,043 | +$21,218 (+14.1%) |
| 25 | $167,144 | $169,867 | +$2,723 (+1.6%) | $187,193 | +$20,049 (+12.0%) | $197,036 | +$29,892 (+17.9%) |
| 30 — Retirement | $185,229 | $188,856 | +$3,627 (+2.0%) | $212,202 | +$26,973 (+14.6%) | $225,660 | +$40,431 (+21.8%) |
| 35 | $211,293 | $215,346 | +$4,053 (+1.9%) | $240,551 | +$29,258 (+13.8%) | $258,443 | +$47,150 (+22.3%) |
| 40 | $241,024 | $245,552 | +$4,528 (+1.9%) | $272,687 | +$31,663 (+13.1%) | $295,987 | +$54,963 (+22.8%) |
| 45 | $274,939 | $279,995 | +$5,056 (+1.8%) | $309,117 | +$34,178 (+12.4%) | $338,986 | +$64,047 (+23.3%) |
| 50 | $313,625 | $319,268 | +$5,643 (+1.8%) | $350,414 | +$36,789 (+11.7%) | $388,232 | +$74,607 (+23.8%) |
| 55 | $357,756 | $364,051 | +$6,295 (+1.8%) | $397,227 | +$39,471 (+11.0%) | $444,632 | +$86,876 (+24.3%) |
| 60 — End of Plan | $408,096 | $415,115 | +$7,019 (+1.7%) | $450,295 | +$42,199 (+10.3%) | $509,225 | +$101,129 (+24.8%) |
Hypothetical illustration. Credit risk, interest rate risk, and other bond risks are not modeled. Does not represent actual results.
What stands out
- CA municipal bonds win decisively — despite the lowest gross yield of the four
- The gap opens immediately — CA munis are $674 ahead of corporate even in Year 1
- Municipal bonds build a large advantage during accumulation — +21.8% vs corporate at Year 30
- The percentage gap narrows slightly in retirement — because corporate and Treasury after-tax yields improve as the tax bracket drops, while muni benefits stay flat
- The absolute dollar gap keeps growing through retirement — because the portfolio is larger
- Treasury bonds provide modest advantage over corporate — meaningful, but far smaller than municipal bonds
How Tax-Equivalent Yield Explains the Difference
🌱 Accumulation (Years 1–30): How Your After-Tax Returns Compound
During 30 years of accumulation, the mechanism is straightforward.
Corporate bonds pay 4% — but 48.1% of every dollar of your interest goes to taxes before reinvestment. After-tax compounding rate: approximately 2.08%.
Treasury bonds pay 3.5% and escape California state tax — but federal income tax and NIIT still apply to your returns. After-tax compounding rate: approximately 2.14%. Marginally better than corporate despite a lower gross yield — the California exemption matters even modestly.
Municipal bonds pay 2.80% — subject only to California's 9.3% state tax on your income. After-tax compounding rate: approximately 2.54%. Despite the lower gross yield, municipal bonds compound faster than both corporate and Treasury bonds throughout your accumulation years.
California municipal bonds pay 2.75% — zero tax on your income. Every dollar of your interest reinvests. After-tax compounding rate: 2.75% — the highest of the four, despite the lowest gross yield.
By Year 30, your CA municipal portfolio would have grown to $225,660. The corporate portfolio would have reached $185,229. The bond paying 1.25% less per year would have produced $40,431 more in your account.
Retirement (Years 31–60): What Happens When Your Tax Bracket Drops
Something important happens in your retirement when tax rates drop. For corporate and Treasury bonds, the lower bracket significantly improves your after-tax yield:
- Corporate bonds: after-tax yield rises from 2.08% to 2.67% — much more competitive
- Treasury bonds: after-tax yield stays near 2.66% — NIIT disappears, your rate drops, CA still exempt
- Municipal bonds: after-tax yield stays fixed at 2.54% — California's 9.3% still applies to your income regardless of bracket
- CA municipal bonds: after-tax yield stays at 2.75% — no tax on your income at any rate to drop
This is why the percentage gap between corporate and CA municipal bonds narrows slightly in your retirement — from 21.8% at Year 30 to 24.8% at Year 60 (the gap grows in absolute dollars but grows more slowly in percentage terms). Corporate bonds become more competitive once your high-income bracket drops.
However, the compounding head start built during 30 years of accumulation is already embedded in your account. CA municipal bonds enter your retirement $40,431 ahead — and that advantage continues compounding at 2.75% versus corporate's improved 2.67%.
The absolute gap at Year 60: $101,129.
The Percentage Gap Narrowing — What It Means
It is worth being direct about one observation: the percentage advantage of municipal bonds over corporate bonds is largest during accumulation and narrows somewhat in retirement. This is not a flaw — it reflects an honest reality: if an investor's tax bracket drops significantly in retirement, the tax-efficiency advantage of municipal bonds decreases. In scenarios where retirement tax rates are higher than assumed here, the municipal bond advantage would persist more strongly through retirement.
This reinforces why these analyses are bracket-specific and why the assumption about retirement tax rates matters.
What Is Tax-Efficient Yield and Why Does It Matter?
This section explains the key concepts. Skip ahead if already familiar.
Why Your Bond Interest Is Taxed So Heavily
Bond interest — when taxable — is classified as ordinary income. Unlike qualified stock dividends or long-term capital gains, there is no preferential rate. If you are a high-income investor at the 35% federal bracket, every taxable dollar of your bond interest is taxed at the highest available rate — before California and NIIT stack on top.
This is a structural feature of how the US tax code treats bond income, and it is why bond type — specifically the tax exemption status of your income — matters so much more for bonds than for equities.
The Four Bond Types and Their Tax Treatment
Corporate bonds are fully taxable at all levels: federal income tax, state income tax, and NIIT. They typically offer the highest gross yields to compensate — but if you are a high-income investor in high-tax states, your after-tax yield often underperforms lower-yielding tax-advantaged alternatives.
Treasury bonds are exempt from state income tax but remain fully subject to federal income tax and NIIT. If you are a California investor, the state tax exemption provides you a modest but real advantage over corporate bonds at the same gross yield.
Municipal bonds (issued by states, cities, and local governments) pay interest that is generally exempt from federal income tax and NIIT. If you are a California resident holding out-of-state municipal bonds, you still owe California's 9.3% state tax — but the federal and NIIT exemptions make them significantly more tax-efficient for you than corporate bonds.
California municipal bonds pay interest that is exempt from federal income tax, NIIT, and California state income tax simultaneously. If you are a California resident, this triple exemption makes them the most tax-efficient bond type available to you in a taxable account.
Tax-Equivalent Yield — The Right Comparison Tool for Your Decisions
When comparing taxable and tax-exempt bonds, gross yield might not be the most effective metric for your analysis. The correct tool is probably tax-equivalent yield — the gross yield a taxable bond would need to pay to match your after-tax income from a tax-exempt bond.
Tax-equivalent yield = Tax-exempt yield ÷ (1 − Your combined tax rate)
If you are a California investor in the 48.1% combined bracket during accumulation:
| Bond | Gross Yield | Tax-Equiv. Yield | Comparison to Corporate (4.00%) |
|---|---|---|---|
| CA Municipal | 2.75% | 5.30% | Corporate would need to pay 5.30% to match your after-tax return |
| Municipal | 2.80% | 5.39% | Corporate would need to pay 5.39% to match your after-tax return |
| Treasury | 3.50% | 4.30%* | Corporate needs 4.30% to match your return (CA exempt only) |
| Corporate | 4.00% | 4.00% | Benchmark — fully taxable |
*Treasury tax-equivalent yield uses federal + NIIT rate only (38.8%), since CA is already exempt.
At 4.00%, the corporate bond falls well short of the 5.30% needed to match the CA municipal's 2.75% after-tax return. The CA municipal bond wins clearly at your tax profile.
Critical caveat: Your tax-equivalent yield changes dramatically with your tax rates. At a 22% federal + 9.3% California + 0% NIIT = 31.3% combined rate, a CA municipal bond at 2.75% has a tax-equivalent yield of only 4.00% — barely matching a corporate bond at 4.00%. If you are in a lower bracket, corporate bonds may produce a better after-tax result for you. This analysis applies specifically to high-income investors in high-tax states. It should not be generalized to all investors.
Important Limitations and Context
- Credit risk is not modeled. Corporate, municipal, and Treasury bonds carry different credit risk profiles. US Treasuries carry the lowest credit risk. Municipal bond credit quality varies widely by issuer. This illustration does not account for default probabilities or credit spreads
- Interest rate risk is not modeled. All bonds are assumed held to maturity. In practice, bonds can be sold before maturity at gains or losses depending on interest rate movements
- AMT exposure. Certain private activity municipal bonds may be subject to the Alternative Minimum Tax for some investors. Not addressed in this illustration
- Liquidity differences. Individual municipal bonds can be less liquid than Treasury or large-issuer corporate bonds
- Retirement tax rate assumption. This illustration assumes a lower tax bracket in retirement. As discussed above, if retirement tax rates are higher than assumed, the municipal bond advantage persists more strongly through the full 60 years
- California residency required for CA muni exemption. California municipal bond state-tax exemption applies only to California residents
Where This Fits in the Series
| Layer | What Changed | Primary Benefit |
|---|---|---|
| 1: Asset location | Which accounts hold which assets | Shelters bond interest from annual taxation |
| 2: Tax-loss harvesting | Captures paper losses to offset gains | Defers capital gains, reduces ordinary income |
| 3: Equity fund structure | Qualified dividends and FTC efficiency | Reduces annual tax drag on stock dividends |
| 4: Bond type selection | Tax treatment of bond interest | Reduces annual tax drag on fixed income |
The relationship between Layer 1 and Layer 4 is important: the first priority is to hold bonds inside tax-advantaged accounts where bond type makes no tax difference. Layer 4 becomes relevant when bonds are held in a taxable account — either because tax-advantaged capacity is fully used, or because the overall allocation requires more bonds than can be sheltered.
Are Municipal Bonds Right for Your Taxable Account?
The bond type question — which fixed income belongs in your taxable account — rarely receives as much attention as allocation decisions. But as this illustration suggests, if you are a high-income investor in California with bonds in taxable accounts, the choice of bond type can have a meaningful long-term impact on your after-tax returns.
A few questions that may be worth considering:
- Are any bonds currently held in your taxable brokerage account — and if so, what type?
- Has the tax-equivalent yield been calculated for your specific combined federal, state, and NIIT bracket — not a generic assumption?
- Has the credit quality and risk profile of any municipal bonds been evaluated alongside the tax efficiency benefit?
- Is the bond type decision being reviewed as part of a unified plan that considers account placement, bond type, and your overall tax picture together?
These are questions that tend to surface in a comprehensive, tax-aware financial planning engagement — not a standard portfolio review.
- Schedule a free conversation →
- Read how we think about tax efficiency overall →
- Part 1: Tax-Efficient Asset Location →
- Part 2: Tax-Loss Harvesting →
- Part 3: Equity Fund Tax Drag →
- Series Summary: Four Layers of Tax Efficiency →
Technical Notes and Full Assumptions
Setup
| Detail | Value |
|---|---|
| Starting balance | $100,000 |
| Annual contribution | $0 |
| Accumulation phase | Years 1–30 |
| Retirement phase | Years 31–60 |
| Holding assumption | Bonds held to maturity, no credit events |
Bond Types and Hypothetical Gross Yields
| Bond Type | Hypothetical Gross Yield |
|---|---|
| Corporate bonds | 4.00% |
| Treasury bonds | 3.50% |
| Municipal bonds | 2.80% |
| California municipal bonds | 2.75% |
Tax Rates — Accumulation (Years 1–30)
| Bond Type | Federal | CA State | NIIT | Combined | After-Tax Yield |
|---|---|---|---|---|---|
| Corporate | 35% | 9.3% | 3.8% | 48.1% | 2.08% |
| Treasury | 35% | Exempt | 3.8% | 38.8% | 2.14% |
| Municipal | Exempt | 9.3% | Exempt | 9.3% | 2.54% |
| CA Municipal | Exempt | Exempt | Exempt | 0% | 2.75% |
Tax Rates — Retirement (Years 31–60)
| Bond Type | Federal | CA State | NIIT | Combined | After-Tax Yield |
|---|---|---|---|---|---|
| Corporate | 24% | 9.3% | 0% | 33.3% | 2.67% |
| Treasury | 24% | Exempt | 0% | 24.0% | 2.66% |
| Municipal | Exempt | 9.3% | 0% | 9.3% | 2.54% |
| CA Municipal | Exempt | Exempt | 0% | 0% | 2.75% |
Modeling Approach
- All bond interest paid annually and taxed in the year received
- After-tax interest reinvested each year at the after-tax yield
- Price appreciation not modeled — bonds assumed held to maturity at par
- No credit events, calls, or reinvestment risk modeled
- NIIT removed in retirement for all bond types
- California state tax exemption for Treasury bonds per current federal law
- Municipal bond interest assumed from investment-grade, non-AMT bonds
- All figures in nominal dollars
This post is for educational purposes only and does not constitute individualized investment, tax, or legal advice. All scenarios are hypothetical illustrations and do not represent actual bond, client, or investment results. Bond type selection involves considerations beyond tax efficiency — including credit risk, interest rate risk, liquidity, duration, and individual tax circumstances — that are not modeled in this illustration. Municipal bond credit quality varies widely; not all municipal bonds are appropriate for all investors. The tax treatment described reflects current federal and California law as of the date of publication and is subject to change. The Alternative Minimum Tax may apply to certain municipal bond income for some investors and is not addressed here. Tax-equivalent yield calculations are specific to the tax rates used and will differ at other income levels or in other states. Tax-aware strategies are designed to be mindful of a client's tax situation but cannot guarantee specific tax outcomes. All investing involves risk, including the potential loss of principal. We do not provide tax preparation services — please consult a qualified tax professional and a qualified financial professional regarding your individual circumstances. Advisory services offered through Trusted Path Wealth Management, LLC, an investment adviser registered with California. Registration does not imply a certain level of skill or training.